In this post we will see how a packet generated by a VM is able to reach another VM or an external resource, what are the key concepts/components in the context of Neutron using the OpenContrail plugin. We will focus on OpenContrail, how it implements the overlay and the tools that it provides to check/troubleshoot how the packet are forwarded. Before getting started, I’ll give a little overview of the key concepts of OpenContrail.
Virtual networks, Overlay with OpenContrail
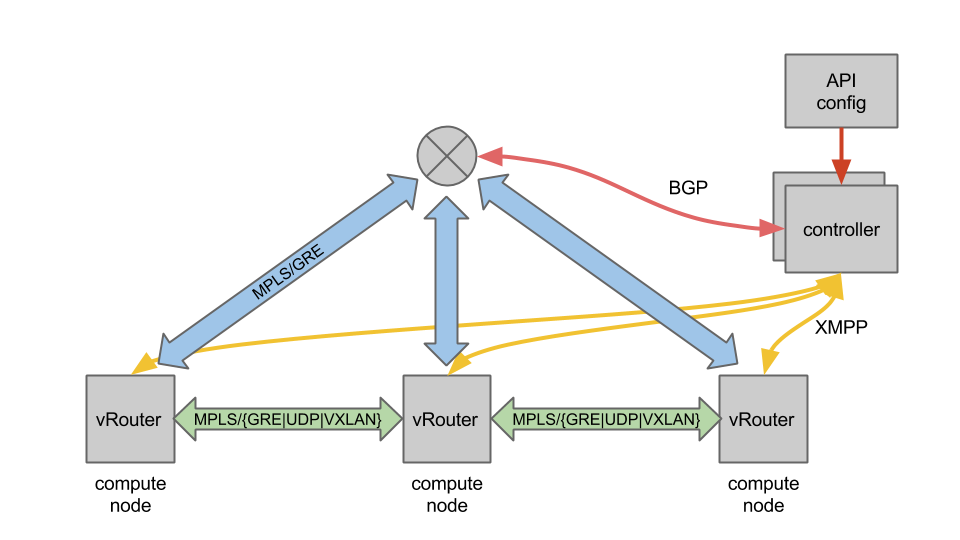
For the overlay, OpenContrail uses MPLS L3VPNs and MPLS EVPNs in order to address both l3 overlay and l2 overlay. There are a lot of components within OpenContrail, however we will focus on two key components – controller and the vRouter.
For the control plane each controller acts as a BGP Route Reflector using the BGP and the XMPP protocols. BGP is used between the controllers and the physical routers. XMPP is used between the controllers and the vRouters. The XMPP protocol transports BGP route announcements but also some other informations for non routing needs.
For the data plane, OpenContrail supports GRE/VXLAN/UDP for the tunneling. OpenContrail requires the following features to be supported by the gateway router :
- L3VPN
- MP-BGP
- Dynamic Tunneling
 In this post we will focus on the data plane area.
The packet’s journey
In order to show what is the journey of a packet, let’s play with the following topology, where we have two VMs on two different networks connected thanks to a router.
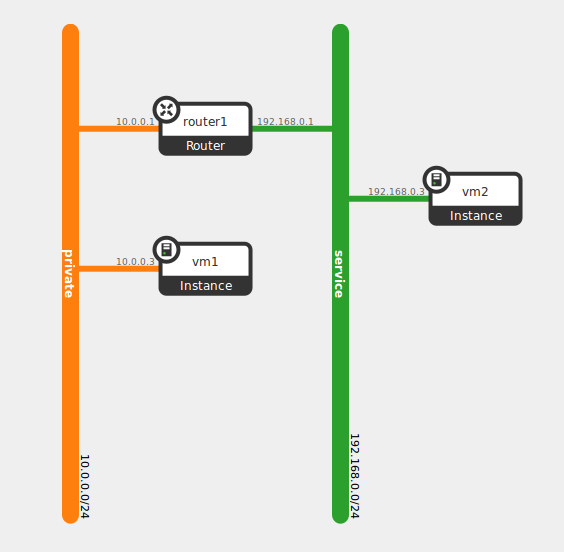 Assuming we have allowed the ICMP packets by setting the security groups accordingly we can start a ping from vm1 toward vm2.
There are a lot of introspection tools within OpenContrail which can be used to get a clear status on how the packets are forwarded.
Initiating a ping between vm1 and vm2, we can check step by step where the packets go.
Since the VMs are not on the same network, they will both use their default gateway. The local vRouter answers to the ARP request of the default gateway IP with its own MAC.
vm1$ ip route
default via 10.0.0.1 dev eth0
10.0.0.0/24 dev eth0  src 10.0.0.3

$ cat /proc/net/arp
IP address       HW type     Flags       HW address            Mask     Device
10.0.0.1         0x1         0x2         00:00:5e:00:01:00     *        eth0
Now that we have seen that the packets will be forwarded to the local vRouter, we are going to check how the vRouter will forward them.
So let’s start by checking at the data plane layer by browsing the vRouter agent introspect Web interface running on the compute nodes hosting our VMs at http://<vrouter agent ip>:8085/agent.xml
There is a plenty of sub-interfaces, but we will only use three of them:
- VrfListReq, http://<vrouter agent ip>:8085/Snh_VrfListReqWhich gives you the networks and the VRFs related. For a given VRF – let’s say the Unicast VRF (ucindex) – we can see all the routes.
- ItfReq, http://<vrouter agent ip>:8085/Snh_ItfReqWhich gives you all the interfaces handled by the vRouter.
- MplsReq, http://<vrouter agent ip>:8085/Snh_MplsReqWhich gives all the association MPLS Label/NextHop for the given vRouter
These interfaces are just XML document rendered thanks to a XSL stylesheet, so can be easily processed by some monitoring scripts for example.
We can start by the interfaces (ItfReq) introspect page to find the TAP interface corresponding to VM1. The name of the TAP contains a part of the neutron port ID.
 Beside the interface we see the VRF name associated to the network that the interface belong to. On the same line we have some others informations, security group, floating-ips, VM id, etc.
Clicking on the VRF link brings us to the index page of this VRF. We see that we have links to VRFs according to their type: Unicast, Multicast, Layer 2. By default, OpenContrail doesn’t handle the Layer 2. As said before most of the Layer 2 traffic from the virtual machines are trapped by the local vRouter which acts as an ARP responder. But some specific packets like broadcasts still need to be handled, that’s why there is a specific Layer 2 VRF.
 Clicking on the link in the ucindex (Unicast) column, we can see all the unicast L3 routes of our virtual network handled by this vRouter. Since vm1 should be able to reach vm2, we should see a route with the IP of vm2.
 Thanks to this interface we see that in order to reach the IP 192.168.0.3 which is the IP of our vm2, the packet is going to be forwarded through a GRE tunnel whose endpoint is the IP of the compute node hosting vm2. That’s what we see in the “dip” (Destination IP) field. We see that the packet will be encapsulated in a MPLS packet. The MPLS label will be 16, as shown in the label column.
Ok, so we saw at the agent level how the packet is going to be forwarded, but we may want to check on the datapath side. OpenContrail provides command line tools for that purpose.
In the case of the agent for instance, we can see the interfaces handled by the vRouter kernel module and the associated VRF.
$ vif --list
Vrouter Interface Table

Flags: P=Policy, X=Cross Connect, S=Service Chain, Mr=Receive Mirror
      Mt=Transmit Mirror, Tc=Transmit Checksum Offload, L3=Layer 3, L2=Layer 2
      D=DHCP, Vp=Vhost Physical, Pr=Promiscuous, Vnt=Native Vlan Tagged
      Mnp=No MAC Proxy, Dpdk=DPDK PMD Interface, Rfl=Receive Filtering Offload,
      Mon=Interface is Monitored, Uuf=Unknown Unicast Flood

vif0/0      OS: eth0
           Type:Physical HWaddr:fa:16:3e:68:f9:e8 IPaddr:0
           Vrf:0 Flags:TcL3L2Vp MTU:1514 Ref:5
           RX packets:1598309  bytes:315532297 errors:0
           TX packets:1407307  bytes:383580260 errors:0

vif0/1      OS: vhost0
           Type:Host HWaddr:fa:16:3e:68:f9:e8 IPaddr:a2b5b0a
           Vrf:0 Flags:L3L2 MTU:1514 Ref:3
           RX packets:1403461  bytes:383378275 errors:0
           TX packets:1595855  bytes:315456061 errors:0

vif0/2      OS: pkt0
           Type:Agent HWaddr:00:00:5e:00:01:00 IPaddr:0
           Vrf:65535 Flags:L3 MTU:1514 Ref:2
           RX packets:4389  bytes:400688 errors:0
           TX packets:6931  bytes:548756 errors:0

vif0/3      OS: tapa87ad91e-28
           Type:Virtual HWaddr:00:00:5e:00:01:00 IPaddr:0
           Vrf:1 Flags:PL3L2 MTU:9160 Ref:6
           RX packets:565  bytes:105481 errors:0
           TX packets:587  bytes:80083 errors:0

vif0/4350   OS: pkt3
           Type:Stats HWaddr:00:00:00:00:00:00 IPaddr:0
           Vrf:65535 Flags:L3L2 MTU:9136 Ref:1
           RX packets:3  bytes:294 errors:0
           TX packets:3  bytes:252 errors:0

vif0/4351   OS: pkt1
           Type:Stats HWaddr:00:00:00:00:00:00 IPaddr:0
           Vrf:65535 Flags:L3L2 MTU:9136 Ref:1
           RX packets:10  bytes:840 errors:0
           TX packets:10  bytes:840 errors:0
We have our TAP interface at this index 3 and the VRF associated which is the number 1.
Let’s now check the routes for this VRF. For that purpose we use the rt command line.
$ rt --dump 1
Vrouter inet4 routing table 0/1/unicast
Flags: L=Label Valid, P=Proxy ARP, T=Trap ARP, F=Flood ARP

Destination          PPL        Flags        Label         Nexthop    Stitched MAC(Index)

...
192.168.0.3/32         32           LP         16             19        -
...
We see that the MPLS label used is 16. In order to know how the packet will be forwarded we have to check the NextHop used for this route.
$ nh --get 19
Id:19         Type:Tunnel    Fmly: AF_INET  Flags:Valid, MPLSoGRE,   Rid:0  Ref_cnt:2 Vrf:0
             Oif:0 Len:14 Flags Valid, MPLSoGRE,  Data:fa 16 3e 4b f6 05 fa 16 3e 68 f9 e8 08 00
             Vrf:0  Sip:10.43.91.10  Dip:10.43.91.12
We have almost the same informations that the agent gave us. Here in the Oif field, we have the interface where the packet will be sent to the other compute node. Thanks to the vif command line we can get the details about this interface.
$ vif --get 0
Vrouter Interface Table

Flags: P=Policy, X=Cross Connect, S=Service Chain, Mr=Receive Mirror
      Mt=Transmit Mirror, Tc=Transmit Checksum Offload, L3=Layer 3, L2=Layer 2
      D=DHCP, Vp=Vhost Physical, Pr=Promiscuous, Vnt=Native Vlan Tagged
      Mnp=No MAC Proxy, Dpdk=DPDK PMD Interface, Rfl=Receive Filtering Offload, Mon=Interface is Monitored
      Uuf=Unknown Unicast Flood

vif0/0      OS: eth0
           Type:Physical HWaddr:fa:16:3e:68:f9:e8 IPaddr:0
           Vrf:0 Flags:TcL3L2Vp MTU:1514 Ref:5
           RX packets:1602164  bytes:316196179 errors:0
           TX packets:1410642  bytes:384855228 errors:0
As the packet will go through the eth0 interface, a tcpdump should confirm what we described above.
$ sudo tcpdump -n -i eth0 dst 10.43.91.12
12:13:16.908957 IP 10.43.91.10 > 10.43.91.12: GREv0,
length 92: MPLS (label 16, exp 0, [S], ttl 63)
IP 10.0.0.3 > 192.168.0.3: ICMP echo request, id 5889, seq 43, length 64
As the tunnel endpoint shows, the packet will be directly forwarded to the compute node that is hosting the destination VM, not using a third party routing device.
On the other side, the vRouter on the second compute node will receive the encapsulated packet. According to the MPLS Label, it does a lookup on a MPLS Label/NextHop as we can see on its introspect.

As we can see here the NextHop field for the Label 16 is the TAP interface of our second VM. On the datapath side we can check the same informations. Checking the MPLS Label/NextHop table :
$ mpls --get 16
MPLS Input Label Map

  Label    NextHop
-------------------
     16        14
..and finally the NextHop and the interface with the following commands :
$ nh --get 14
Id:14         Type:Encap     Fmly: AF_INET  Flags:Valid, Policy,   Rid:0  Ref_cnt:4 Vrf:1
             EncapFmly:0806 Oif:3 Len:14 Data:02 8a 39 ff 98 d3 00 00 5e 00 01 00 08 00
$ vif --get 3
Vrouter Interface Table

Flags: P=Policy, X=Cross Connect, S=Service Chain, Mr=Receive Mirror
      Mt=Transmit Mirror, Tc=Transmit Checksum Offload, L3=Layer 3, L2=Layer 2
      D=DHCP, Vp=Vhost Physical, Pr=Promiscuous, Vnt=Native Vlan Tagged
      Mnp=No MAC Proxy, Dpdk=DPDK PMD Interface, Rfl=Receive Filtering Offload, Mon=Interface is Monitored
      Uuf=Unknown Unicast Flood

vif0/3      OS: tap8a39ff98-d3
           Type:Virtual HWaddr:00:00:5e:00:01:00 IPaddr:0
           Vrf:1 Flags:PL3L2 MTU:9160 Ref:6
           RX packets:2957  bytes:293636 errors:0
           TX packets:3085  bytes:297115 errors:0
This post was just an overview on how the packets are forwarded from one node to another and what are the interfaces/tools that you can use for troubleshooting purpose. One of the interesting thing with OpenContrail is that almost all the components have their own introspect interface helping you a lot during troubleshooting sessions. As we saw, the routing is fully distributed in OpenContrail, each vRouter handles a part of the routing using well known routing protocols like BGP/MPLS which proved their ability to scale.